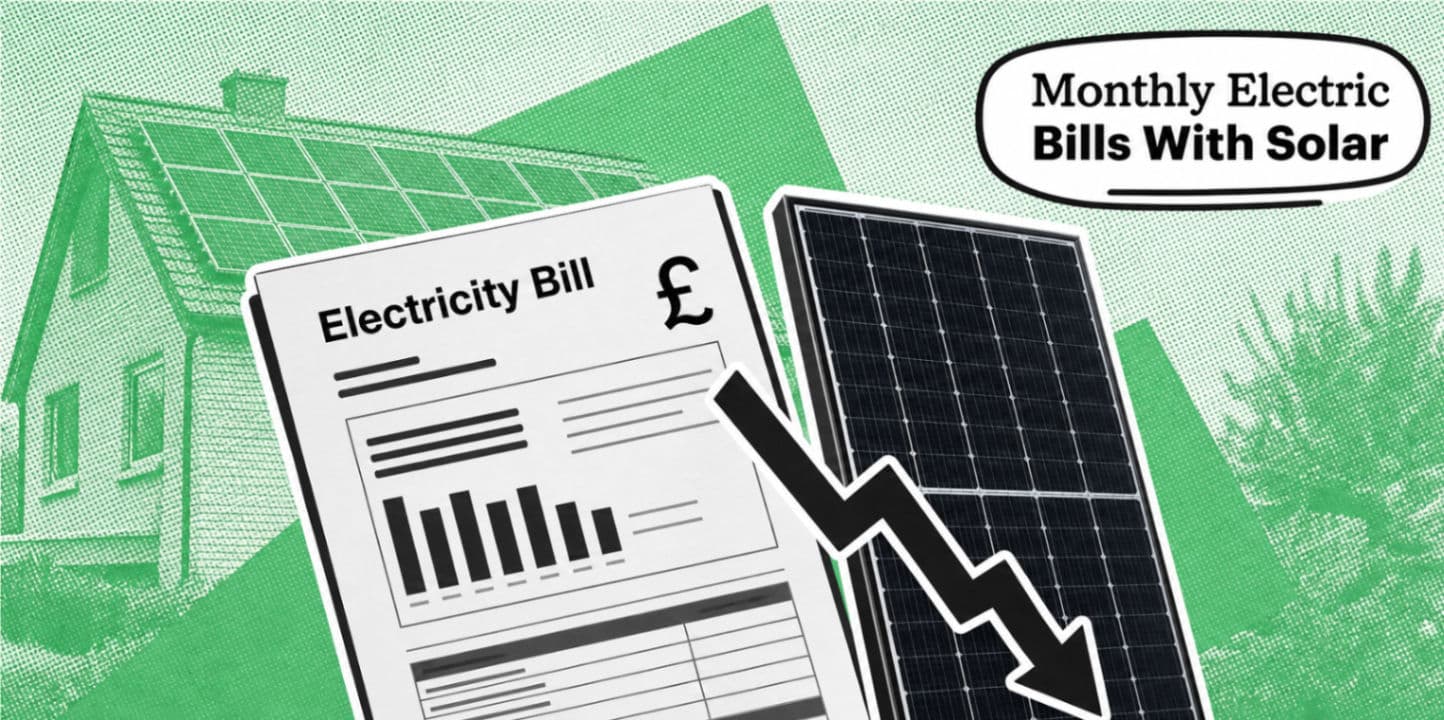

A typical UK household with solar panels might pay around £50 to £70 a month for electricity, although homes with a well-matched solar and battery system may pay considerably less.
That is the quick answer. The slightly less convenient answer is that there is no official “average solar electricity bill” covering every UK home.
Your monthly bill will depend on how much electricity you use, how much your panels generate, whether you have a battery and how much solar electricity you use before it escapes into the grid.
Solar panels can substantially reduce electricity costs, but they will not normally make your bill disappear completely. Standing charges, gloomy winter afternoons and the continued existence of night-time all see to that.
PS We offer MCS-certified solar panel installation nationwide. Simply answer these questions, get your fixed price and arrange your free design.
Average monthly electricity bill with solar panels: a realistic example
To produce a useful estimate, we can model a typical household using Ofgem’s electricity rates for July to September 2026.
The average capped Direct Debit rates across England, Scotland and Wales are:
26.11p per kWh of electricity
57.19p per day standing charge
Ofgem’s current typical domestic consumption benchmark for a single-rate electricity customer is approximately 3,100kWh per year.
Without solar panels, that produces the following estimated bill:
Electricity cost | Annual amount | Monthly average |
3,100kWh at 26.11p | £809 | £67 |
Standing charge | £209 | £17 |
Estimated total | £1,018 | £85 |
Now suppose the home installs a reasonably productive solar system and uses 1,500kWh of its solar electricity directly.
Grid consumption falls from 3,100kWh to 1,600kWh:
Electricity cost after solar | Annual amount | Monthly average |
1,600kWh at 26.11p | £418 | £35 |
Standing charge | £209 | £17 |
Estimated bill | £627 | £52 |
In this example, the household’s average monthly electricity bill falls from approximately £85 to £52.
The panels also generate surplus electricity that can be exported. If the home exports 2,300kWh at an illustrative rate of 10p per kWh, it could receive another £230 a year.
Once that export income is considered, the home’s net electricity cost would be approximately £397 a year, or £33 a month.
That does not mean the supplier will necessarily issue a £33 bill every month. Export income may be paid separately, and solar output changes significantly throughout the year.
These calculations are examples, not savings guarantees. Tariffs, regional standing charges, solar generation and household consumption will all affect the result.
How much can solar panels reduce electricity bills?
For a typical UK home, a well-designed solar system might reduce electricity costs by approximately £400 to £650 per year, before export payments.
That is equivalent to an average bill reduction of roughly £33 to £54 a month when spread across the year.
The UK Government’s Solar Roadmap estimates that a typical household could save around £500 per year by installing rooftop solar. This works out at approximately £42 a month.
However, annual savings should not be mistaken for a completely flat monthly discount.
Solar generation is highly seasonal. Your panels may generate more electricity than the home needs on a bright June afternoon, then contribute relatively little during a dark December evening when the oven, lights and questionable electric blanket are all running.
Your actual monthly electricity bills are therefore likely to be:
lowest during spring and summer;
higher during autumn and winter; and
influenced by how your supplier calculates Direct Debit payments.
Some suppliers smooth Direct Debit payments across the year. This means the amount leaving your bank each month may remain fairly steady even though your actual electricity imports vary.
What will my monthly bill be after installing solar panels?
The following ranges provide a broad illustration rather than a quotation.
Household and system | Possible monthly electricity bill |
Lower-usage home with a small solar system | £35–£55 |
Typical home with a 3.5–4.5kWp solar system | £50–£70 |
Higher-usage home with solar panels | £70–£110+ |
Well-matched solar and battery system | £25–£55 |
Near-zero grid usage during a summer month | Usually at least £17–£20 due to the standing charge |
These estimates assume a single-rate tariff around the July to September 2026 Ofgem benchmark. They should not be treated as guaranteed results.
A large house with an electric vehicle, heat pump and enthusiastic relationship with the tumble dryer could still have a substantial electricity bill after installing solar.
Meanwhile, a smaller home with low consumption, high daytime usage and a suitable battery may purchase very little electricity during brighter months.
“Has solar panels” is only one part of the calculation.
Why do electricity bills vary so much between solar homes?
Two neighbouring homes can have identical panels and completely different bills.
The main reasons include:
1. Household electricity consumption
A home using 2,000kWh a year will generally have a lower bill than one using 6,000kWh, with or without solar panels.
High-consumption equipment may include:
electric showers;
tumble dryers;
electric vehicles;
hot tubs;
air conditioning;
immersion heaters; and
heat pumps.
Solar can help supply these loads, particularly when they operate during daylight hours, but it does not make their electricity consumption cease to exist.
2. Solar system size
A larger solar array can generate more electricity, provided the roof orientation, shading and system design are suitable.
Most domestic systems are around 3.5–5kWp, but the right size should be based on the property and its electricity use rather than the homeowner winning an unofficial competition with next door.
3. How much solar electricity you use directly
Using solar electricity in the home means you avoid buying that electricity at your import rate.
For example, using 1kWh of solar electricity instead of importing it at 26.11p saves approximately 26p.
Exporting the same unit may earn less, depending on your Smart Export Guarantee tariff. It can therefore be financially valuable to run suitable appliances while your panels are generating.
This does not mean turning every appliance on at noon like the start of a deeply inefficient game show. Smart controls and delayed-start functions can spread demand more sensibly.
4. Roof direction and shading
South-facing roofs often produce the highest annual generation, but east- and west-facing systems can still perform well.
Shading from trees, chimneys or neighbouring buildings can reduce output. Roof angle, location and panel specification also matter.
Solar panels generate electricity from daylight rather than heat, so they still work when it is cloudy. Output is simply lower.
5. Whether you have a solar battery
A battery stores surplus solar electricity for later use, usually during the evening or overnight.
This can reduce grid imports and potentially lower monthly bills further. However, batteries increase the installation cost, so a lower electricity bill does not automatically mean a shorter payback period.
The battery should be sized around your actual generation and consumption. Buying the largest available battery because it looks impressive in the garage is not a financial strategy.
6. Your electricity and export tariffs
The Ofgem price cap limits the rates charged on default tariffs, but it does not mean every household pays the same price.
Rates vary according to:
region;
payment method;
supplier;
fixed or variable tariff;
single-rate or time-of-use pricing; and
standing charge.
Smart Export Guarantee rates also vary by supplier. A higher export rate can improve the overall financial value of your system, although export income usually does not appear as a reduction on your normal electricity bill.
Can solar panels reduce an electricity bill to zero?
Technically, a solar home may import almost no electricity during a particularly bright month. However, receiving a genuinely £0 electricity bill is uncommon.
There are three main reasons.
First, most households still use electricity at night or when solar output is too low. Without a battery, this electricity comes from the grid.
Second, solar panels generate much less electricity during winter.
Third, households normally continue paying a daily standing charge even when they import no electricity. At 57.19p a day, that alone costs approximately £17.40 in an average month.
Export income could offset the standing charge when looking at your overall annual finances, but it will not necessarily remove it from the bill itself.
Do solar panels work out cheaper with a battery?
A battery will often reduce grid electricity purchases by allowing you to use more of your own solar generation.
For example, without a battery, a household may export surplus electricity in the afternoon before buying power back from the grid that evening. A battery can store some of that surplus instead.
Whether the battery saves money overall depends on:
its purchase and installation cost;
usable capacity;
warranty and expected lifespan;
the difference between import and export rates;
how much surplus solar electricity is available;
time-of-use tariff opportunities; and
household consumption patterns.
A battery can produce a lower monthly electricity bill while taking longer to repay the total installation cost. Both things can be true at once, which is mildly irritating but mathematically unavoidable.
How to calculate your electric bill with solar panels
A simplified annual calculation looks like this:
Electricity imported from the grid × import rate
Plus:
365 × daily standing charge
This gives your estimated supplier bill.
To calculate the net annual cost, subtract any income received for exported electricity:
Annual electricity bill − export income = net electricity cost
For example:
annual household consumption: 3,100kWh;
solar electricity used directly: 1,500kWh;
grid electricity imported: 1,600kWh;
import rate: 26.11p per kWh;
annual standing charge: approximately £209;
exported solar electricity: 2,300kWh; and
illustrative export rate: 10p per kWh.
The calculation would be:
Grid electricity: 1,600 × £0.2611 = £417.76
Standing charge: approximately £208.74
Electricity bill: approximately £626.50
Export income: 2,300 × £0.10 = £230
Net annual electricity cost: approximately £396.50
Net monthly average: approximately £33
Again, this is an illustrative scenario. The most meaningful forecast will use a system design and generation estimate specific to your roof.
How can I lower my electricity bill further?
If you already have solar panels, you may be able to improve their financial value by:
using washing machines and dishwashers during solar-generation hours;
scheduling EV charging when solar output is available;
using an immersion diverter where appropriate;
comparing Smart Export Guarantee tariffs;
considering a suitable time-of-use tariff;
monitoring for unexpected falls in system output;
reducing avoidable standby consumption; and
assessing whether battery storage suits your usage.
Do not shift appliances into unattended operation if the manufacturer or fire-safety guidance advises against it.
The aim is to use electricity more intelligently, not to save 14p while introducing an exciting new insurance claim.
Is solar worth it for reducing monthly bills?
For many UK households, yes.
Solar panels can reduce the amount of electricity bought from the grid, while export payments can provide additional value from unused generation.
A typical 4–5kWp domestic solar installation may cost approximately £6,000 to £9,000, with many systems taking around a decade or more to recover their cost. Actual payback depends on the installation price, electricity usage, generation, tariff and export income.
Solar tends to make the strongest financial sense when:
the roof has good solar potential;
shading is limited;
the installation is sensibly priced;
the household uses a reasonable amount of electricity;
some electricity is consumed during daylight hours; and
the homeowner plans to remain in the property for several years.
It is a long-term home-energy investment, not a magic rectangle-based escape from the electricity market.
The verdict
A realistic average monthly electricity bill with solar panels in the UK is around £50 to £70, compared with roughly £85 a month for a typical household at current capped rates.
A well-designed solar and battery system could reduce the bill further, while high-consuming households may continue paying considerably more.
The important figure is not somebody else’s average. It is the expected performance of solar panels on your roof, matched against your electricity use and tariff.
Heatable’s online solar design tool can assess your property, model a suitable panel layout and provide a clearer estimate of potential generation and savings without requiring you to climb onto the roof holding a tape measure.